
Caspian Sea levels over the last 2200 years, with new data from the S-E corner
S.A.G. Leroy a b, P.J. Reimer c, H.K. Lahijani d, A. Naderi Beni d, E. Sauer e, F. Chalié f, K. Arpe g 1, F. Demory f, K. Mertens h, D. Belkacem i, A.A. Kakroodi j, H. Omrani Rekavandi k, J. Nokandeh l, A. Amini m
S.A.G. Leroy a b, P.J. Reimer c, H.K. Lahijani d, A. Naderi Beni d, E. Sauer e, F. Chalié f, K. Arpe g 1, F. Demory f, K. Mertens h, D. Belkacem i, A.A. Kakroodi j, H. Omrani Rekavandi k, J. Nokandeh l, A. Amini m
Highlights
- Revision of Caspian Sea level datapoints over last 2200 years with new point
- Geological and archaeo-historical dara with new calibration of radiocarbon dates
- Derbent lowstand & 2600 yr BP highstand revised, and newly named Parthian highstand
- Ambiguous forcing by temperature, re-inforced role of river diversions
- Amplitude and rate of changes both larger than in the last century
Abstract
A revision of the data used to build the Caspian Sea level curve over the last 2200 years BP has been made based on a combination of geological and archaeo-historical data, using only those for which sufficient metadata were available. This compilation is completed by new sedimentological and palynological data from the south-east corner of the Caspian Sea, especially close to the known termini of the Sasanian Gorgan and Tammisheh Walls. A new calibration of the radiocarbon dates was used, i.e. with a freshwater offset reservoir of 351 ± 33 years. A literature survey of the Derbent lowstand indicated that this term has different definitions, depending on authors; it is thus to be used with caution. Here we therefore prefer to distinguish the mid-Sasanian lowstand and the later Medieval moderate lowstand. The “2600 years BP highstand” has not been found, mostly due to the calibration or recalibration of the datapoints used; data are indeed lacking at that time. Instead, a younger Parthian highstand (around 50 BC–50 AD) is clearly defined. The maximal amplitude and speed of change of the Caspian Sea level were respectively of >15 m and 14 cm per year. Compared to last century, the latter rate is 25% higher, but the amplitude is more than five times larger. The climatic causes of the Caspian Sea level changes are discussed. It is far from a simple case of temperature forcing; temperature forcing may result in several effects, that may impact the Caspian Sea level variations in opposite ways. Moreover, human intervention on river diversion and natural hazards were likely, for several time periods.
A revision of the data used to build the Caspian Sea level curve over the last 2200 years BP has been made based on a combination of geological and archaeo-historical data, using only those for which sufficient metadata were available. This compilation is completed by new sedimentological and palynological data from the south-east corner of the Caspian Sea, especially close to the known termini of the Sasanian Gorgan and Tammisheh Walls. A new calibration of the radiocarbon dates was used, i.e. with a freshwater offset reservoir of 351 ± 33 years. A literature survey of the Derbent lowstand indicated that this term has different definitions, depending on authors; it is thus to be used with caution. Here we therefore prefer to distinguish the mid-Sasanian lowstand and the later Medieval moderate lowstand. The “2600 years BP highstand” has not been found, mostly due to the calibration or recalibration of the datapoints used; data are indeed lacking at that time. Instead, a younger Parthian highstand (around 50 BC–50 AD) is clearly defined. The maximal amplitude and speed of change of the Caspian Sea level were respectively of >15 m and 14 cm per year. Compared to last century, the latter rate is 25% higher, but the amplitude is more than five times larger. The climatic causes of the Caspian Sea level changes are discussed. It is far from a simple case of temperature forcing; temperature forcing may result in several effects, that may impact the Caspian Sea level variations in opposite ways. Moreover, human intervention on river diversion and natural hazards were likely, for several time periods.
1. Introduction
The coastal zones are the most densely populated regions of the world. It is thus of crucial importance to understand how and why water levels are changing, not only along marine coasts, but also along the shores of large lakes. The Caspian Sea is the largest inland body worldwide. Its south and south-western coasts have the largest urban concentrations with several towns of >800,000 inhabitants (Kurtubadze, 2020). In the last century, the water levels of the Caspian Sea have changed dramatically at a scale close to 3 m, with direct impact on oil and gas infrastructure as well as agricultural and urban development along the coast (Fig. 1a, b and c) (e.g. Kakroodi et al., 2014a).
The coastal zones are the most densely populated regions of the world. It is thus of crucial importance to understand how and why water levels are changing, not only along marine coasts, but also along the shores of large lakes. The Caspian Sea is the largest inland body worldwide. Its south and south-western coasts have the largest urban concentrations with several towns of >800,000 inhabitants (Kurtubadze, 2020). In the last century, the water levels of the Caspian Sea have changed dramatically at a scale close to 3 m, with direct impact on oil and gas infrastructure as well as agricultural and urban development along the coast (Fig. 1a, b and c) (e.g. Kakroodi et al., 2014a).
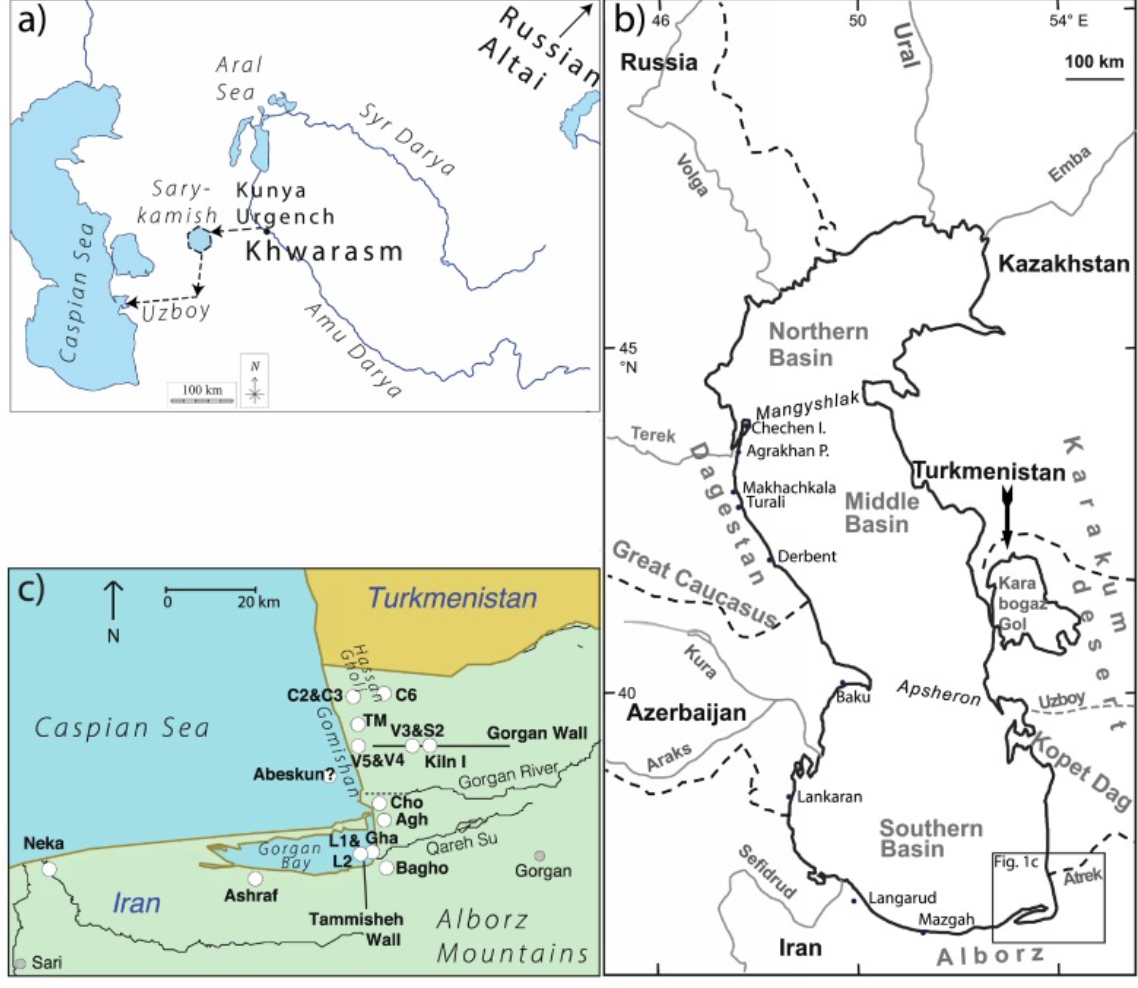
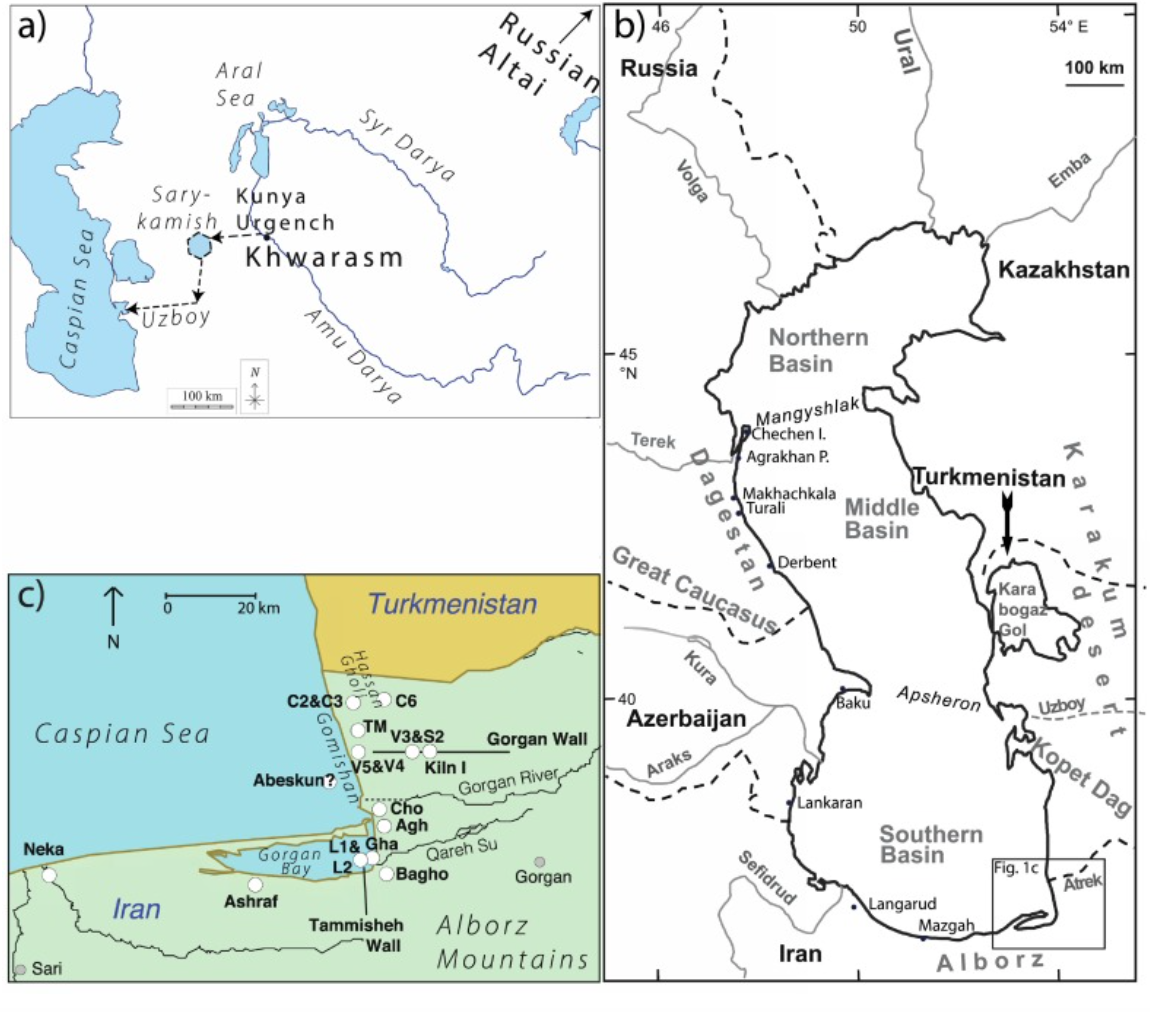
Fig. 1. Maps
a: The Caspian Sea with its link to the Amu Darya (black arrow).b: The Caspian Sea with the main data points around the sea.
c: Details of the points used for the S-E corner of the CS (white circles). Small grey circles for towns.
a: The Caspian Sea with its link to the Amu Darya (black arrow).b: The Caspian Sea with the main data points around the sea.
c: Details of the points used for the S-E corner of the CS (white circles). Small grey circles for towns.
The Caspian Sea levels (CSL) are mostly dependent on the main inflowing river, i.e. the Volga River whose drainage basin is in middle and northern Europe (Leroy et al., 2020). It brings, depending on the year, between 80 and 90% of the water. The Volga discharge on its own thus explains a large portion of the CSL variability (Arpe and Leroy, 2007). Over time, further prominent factors are evaporation and wind direction (Arpe et al., 2020), and the presence of other important inflowing rivers such as the Amu Darya and human intervention (Naderi Beni et al., 2013; Haghani et al., 2016; Leroy et al., 2019a, Leroy et al., 2020; Sala, 2019) (Fig. 1). Natural hazards and human activities have repeatedly modified the course of the Amu Darya and Syr Darya in their deltas near the Aral Sea, causing several river diversions from the Aral Sea to the Caspian Sea leading to rather sudden CSL rises and falls in the last 2500 years (Sala, 2019) (Fig. 1a).
Over the last millennium, the levels may have changed by >9 m, perhaps even by as much as 19 m (Naderi Beni et al., 2013). Over the Late Pleistocene-Holocene period, CSL amplitude reached more than 100 m (Svitoch, 2012; Maksaev et al., 2015; Bezrodnykh and Sorokin, 2016). It has recently been shown that, via an impact on the width of the coastal plain at the foot of the Alborz Mountains (Fig. 1), the CSL have had a direct impact on the diet of Mesolithic and Neolithic populations (Leroy et al., 2019b). When sea levels were high, seal, deer and water bird bones were found in coastal caves, whereas when sea levels were low, the coastal plain significantly enlarged providing hunters with access to a wide range of herbivores (Leroy et al., 2019b). From a geomorphological point of view, fluctuations of river base levels have been shown to modify river courses and river downcutting far inland (>400 km in the Kura Basin) (Ollivier et al., 2016) (Fig. 1b). Avulsions of Caspian rivers have taken place repeatedly, lagoons have appeared and disappeared, often driven by CSL changes (Hoogendoorn et al., 2005; Kroonenberg et al., 2007; Leroy et al., 2011; Haghani and Leroy, 2016).
These changes in the level and the size of the Caspian Sea have had an influence not only on the regional climate but also, by teleconnections, worldwide (Arpe et al., 2019; Koriche et al., 2021); hence the importance to understand CSL drivers in order to better prepare mitigation plans.
Despite over a century of research, the CSL curve is still poorly known even for the last millennia (Leroy et al., 2020). The methods used for the reconstructions in these recent times often combine radiocarbon dating of geological sequences with archaeological and historical information. Unfortunately, the CSL curves of Varushchenko et al. (1987), Karpychev (2001), Hoogendoorn et al. (2010) and Svitoch (2012), are not only different but often contradictory. Fig. 6 in Naderi Beni et al. (2013) publication illustrates well this difficulty for the last millennium with data from Brückner (1890), Varushchenko et al. (1987) and Karpychev, 1998, Karpychev, 2001 displaying overlapping and criss-crossing curves.
Metadata are often incomplete or even absent, such as radiocarbon dates in Svitoch (2012), in the Volga Delta study of Hoogendoorn et al. (2010) and the various sites of Rychagov (1977). When some metadata for each point on the curve are available, such as in Varushchenko et al. (1987) and Karpychev, 1993, Karpychev, 2001 allowing adjusting CSL curves with a new radiocarbon calibration, it remains nevertheless hard to obtain a meaningful synthesis, as essential information such as either elevation or coordinates are not available. These problems highlight the need of providing clear metadata and to calibrate – and recalibrate when progress is made – radiocarbon dates to combine these with the usually more precise archaeological and historical data. Without this, the combination of calendar and non-calendar dates is misleading. Difficulties occur in integrating old (sometimes with large standard deviations) and more recent datasets. Moreover, calibration of the Caspian Sea radiocarbon dates has been so far more difficult than calibration of dates from the sea or lakes due to its fluctuating state between sea and lake over geological times (Hoyle et al., 2021). This is de facto slowing down relative sea-level reconstructions such as those already made in the Mediterranean Sea combining geology and archaeology (e.g. Marriner and Morhange, 2006).
The well-cited CSL curve of Rychagov (1997) is lacking data points between approx. 2600 and 800 years ago, i.e. a gap of ca 1800 years shown by a dashed line. This is only partially filled by the compilation by Naderi Beni et al. (2013)with a starting point at ca 1000 yr ago. This period without data is of great interest to archaeologists and historians, especially for the regions inhabited in the past around the Caspian Sea, i.e. in general the south, south-west and south-east coasts. An outstanding feature are the long walls built to defend the Persian empire's inhabitants from northerners in the Late Sasanian era (5th–6th century AD) (Kudrjavcev and Gadžiev, 2002; Aliev et al., 2006; Sauer et al., 2013), with several walls reaching the Caspian Sea. Most of them were built between the Caspian coastline and a relief, such as the Alborz or Caucasus Mountains when the sea level was lower than at present (Fig. 1b and c).
A compilation of data including new information is presented here with the aims of:
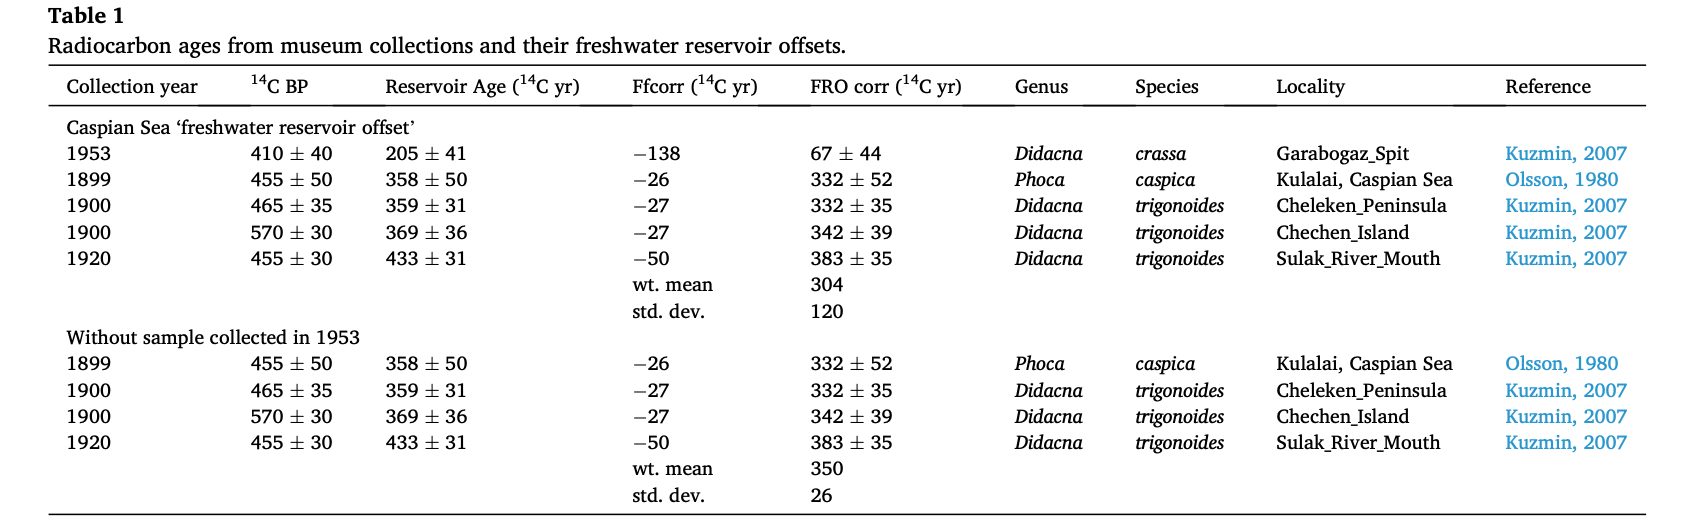
Additionally, the recent release of the new calibration curve IntCal20 (Reimer et al., 2020) and the use of a new freshwater reservoir offset correction lends to an in-depth reassessment of published and unpublished radiocarbon dates (Stuiver et al., 2021) with the possibility to either recalibrate them or, even for some, to calibrate them for the first time.
Over the last millennium, the levels may have changed by >9 m, perhaps even by as much as 19 m (Naderi Beni et al., 2013). Over the Late Pleistocene-Holocene period, CSL amplitude reached more than 100 m (Svitoch, 2012; Maksaev et al., 2015; Bezrodnykh and Sorokin, 2016). It has recently been shown that, via an impact on the width of the coastal plain at the foot of the Alborz Mountains (Fig. 1), the CSL have had a direct impact on the diet of Mesolithic and Neolithic populations (Leroy et al., 2019b). When sea levels were high, seal, deer and water bird bones were found in coastal caves, whereas when sea levels were low, the coastal plain significantly enlarged providing hunters with access to a wide range of herbivores (Leroy et al., 2019b). From a geomorphological point of view, fluctuations of river base levels have been shown to modify river courses and river downcutting far inland (>400 km in the Kura Basin) (Ollivier et al., 2016) (Fig. 1b). Avulsions of Caspian rivers have taken place repeatedly, lagoons have appeared and disappeared, often driven by CSL changes (Hoogendoorn et al., 2005; Kroonenberg et al., 2007; Leroy et al., 2011; Haghani and Leroy, 2016).
These changes in the level and the size of the Caspian Sea have had an influence not only on the regional climate but also, by teleconnections, worldwide (Arpe et al., 2019; Koriche et al., 2021); hence the importance to understand CSL drivers in order to better prepare mitigation plans.
Despite over a century of research, the CSL curve is still poorly known even for the last millennia (Leroy et al., 2020). The methods used for the reconstructions in these recent times often combine radiocarbon dating of geological sequences with archaeological and historical information. Unfortunately, the CSL curves of Varushchenko et al. (1987), Karpychev (2001), Hoogendoorn et al. (2010) and Svitoch (2012), are not only different but often contradictory. Fig. 6 in Naderi Beni et al. (2013) publication illustrates well this difficulty for the last millennium with data from Brückner (1890), Varushchenko et al. (1987) and Karpychev, 1998, Karpychev, 2001 displaying overlapping and criss-crossing curves.
Metadata are often incomplete or even absent, such as radiocarbon dates in Svitoch (2012), in the Volga Delta study of Hoogendoorn et al. (2010) and the various sites of Rychagov (1977). When some metadata for each point on the curve are available, such as in Varushchenko et al. (1987) and Karpychev, 1993, Karpychev, 2001 allowing adjusting CSL curves with a new radiocarbon calibration, it remains nevertheless hard to obtain a meaningful synthesis, as essential information such as either elevation or coordinates are not available. These problems highlight the need of providing clear metadata and to calibrate – and recalibrate when progress is made – radiocarbon dates to combine these with the usually more precise archaeological and historical data. Without this, the combination of calendar and non-calendar dates is misleading. Difficulties occur in integrating old (sometimes with large standard deviations) and more recent datasets. Moreover, calibration of the Caspian Sea radiocarbon dates has been so far more difficult than calibration of dates from the sea or lakes due to its fluctuating state between sea and lake over geological times (Hoyle et al., 2021). This is de facto slowing down relative sea-level reconstructions such as those already made in the Mediterranean Sea combining geology and archaeology (e.g. Marriner and Morhange, 2006).
The well-cited CSL curve of Rychagov (1997) is lacking data points between approx. 2600 and 800 years ago, i.e. a gap of ca 1800 years shown by a dashed line. This is only partially filled by the compilation by Naderi Beni et al. (2013)with a starting point at ca 1000 yr ago. This period without data is of great interest to archaeologists and historians, especially for the regions inhabited in the past around the Caspian Sea, i.e. in general the south, south-west and south-east coasts. An outstanding feature are the long walls built to defend the Persian empire's inhabitants from northerners in the Late Sasanian era (5th–6th century AD) (Kudrjavcev and Gadžiev, 2002; Aliev et al., 2006; Sauer et al., 2013), with several walls reaching the Caspian Sea. Most of them were built between the Caspian coastline and a relief, such as the Alborz or Caucasus Mountains when the sea level was lower than at present (Fig. 1b and c).
A compilation of data including new information is presented here with the aims of:
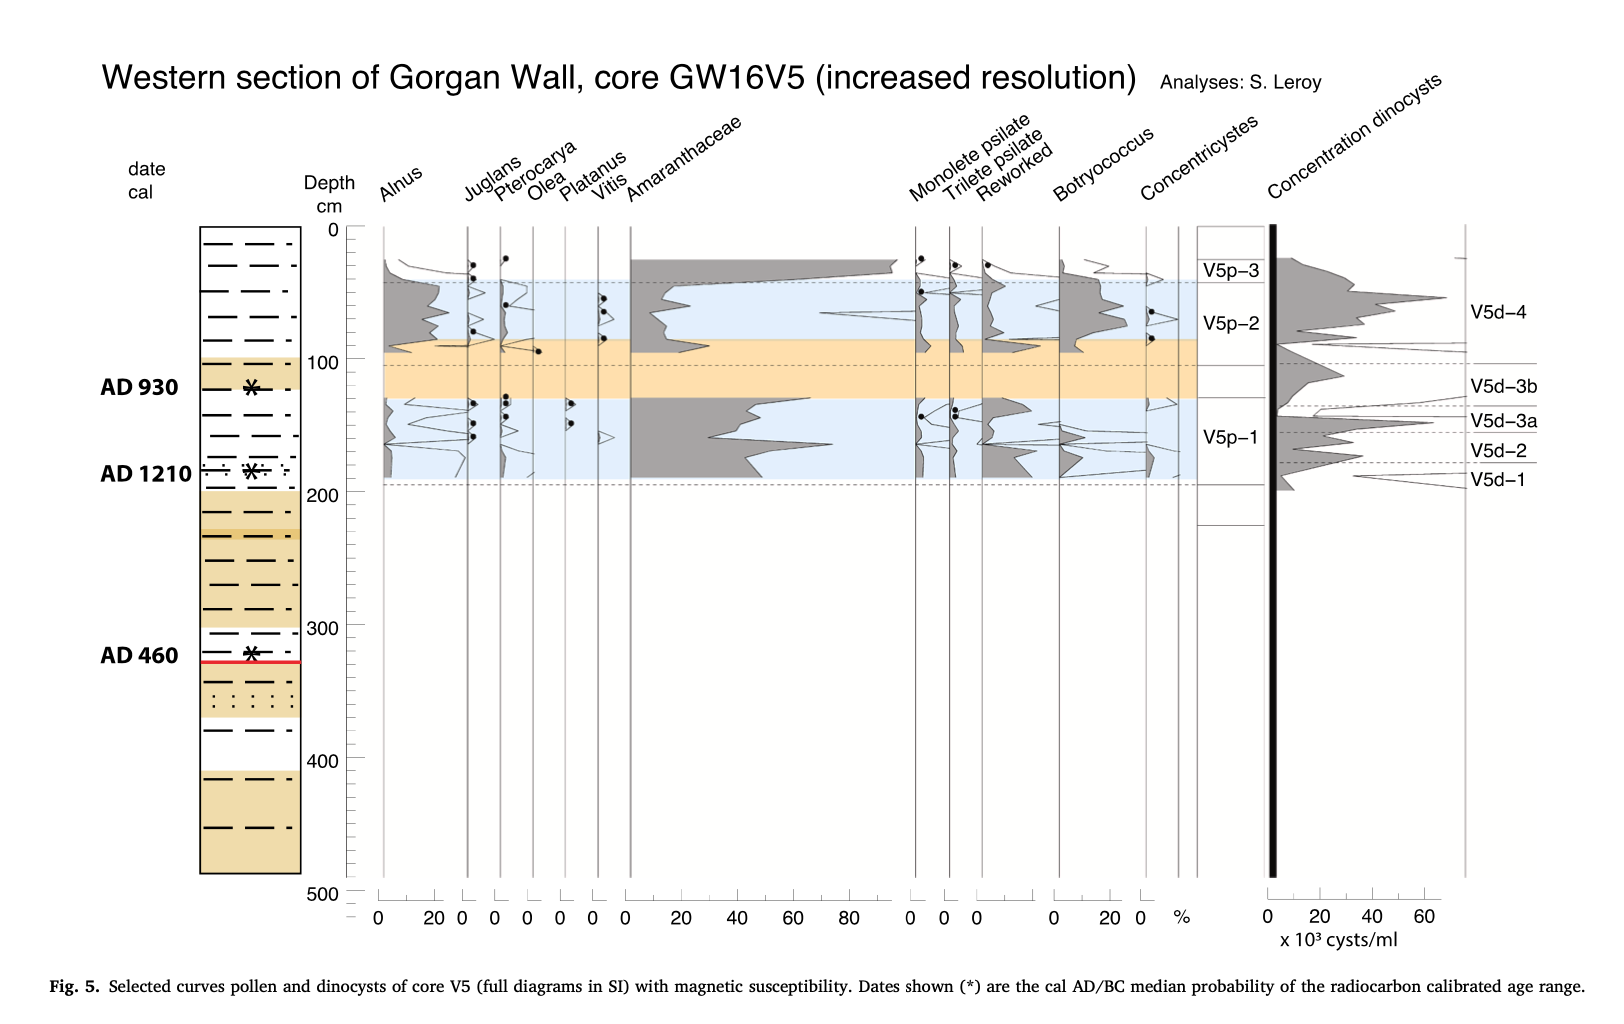
- 1.Reconstructing palaeoenvironments (mostly by pollen and dinocysts analyses) and CSL at the end sections of the Gorgan and Tammisheh Walls, built during a period of lowstand in the Sasanian era, an era spanning from 224 AD to 651 (3.1 Gorgan Bay: top of the Gharasoo sequence, 3.2 Western terminus of the Gorgan Wall: Cores GW16V4 and GW16V5, 3.3 SE of the Hassan Gholi: top of core TM), including the Gorgan Wall project and other previous ones in the region.
- 2.Filling in the sea level curve gap between the published “2600 yr BP highstand” and the CSL curve covering the last 1000 years, compiling geological (3.4 Transects and radiocarbon dates from other places, 3.5 Geological data and Caspian Sea levels) and archaeo-historical data (part 2).
- 3.Finally, discussing a more complete sea level curve for the last 2200 years based on the combination of geological and archaeo-historical data and searching for water level drivers (part 3).
Additionally, the recent release of the new calibration curve IntCal20 (Reimer et al., 2020) and the use of a new freshwater reservoir offset correction lends to an in-depth reassessment of published and unpublished radiocarbon dates (Stuiver et al., 2021) with the possibility to either recalibrate them or, even for some, to calibrate them for the first time.
3.3. SE of the Hassan Gholi: top of core TM
We focus here on the top 660 cm of the long core TM, in order to assess environmental changes in approximately the last 2200 years. Li- thology, radiocarbon dates and pollen were first published in Leroy et al. (2013a) and Kakroodi et al. (2015); but for the dinocyst counts, sums were increased over the whole 27.5 m of the sequence to allow building a separate dinocyst diagram (Fig. SI 7), as done for the other sequences of cores V5 and Gha.
In brief, the lithology is a dark to grey clay and silt becoming a mottled silt from 660 to 495 cm depth (Leroy et al., 2013a; Kakroodi et al., 2015). After a sharp change at 495 cm, the sediment becomes a very brown to reddish fine sand and sandy silt, with mottling. It is fol- lowed between 400 and 250 cm depth by three dark clayey silt units, with erosional features at the top of each of them with, in between them, fine silt to fine sand bearing signs of oxidation. Two radiocarbon dates are available, one at 475 cm with a median probability of cal 400 AD and one at 250 cm of cal 910 AD (Table 4a).
Pollen details (16 samples) have already been provided in Leroy et al. (2013a). In brief (Fig. 6 and SI 5): In zone TMp-7a and b, the landscape is very open with high amounts of plants from the desert and saline soils (most likely Chenopods in the family of the Amaranthaceae) and plants from the steppe. However, in zone 7b, a slight increase of Quercus is noticeable to the detriment of Alnus and Carpinus betulus. At the end of zone 7a, a very large peak of reworked elements is remarkable. It is derived from a sample taken in the reddish sands at 495–400 cm. In zone TMp-8, Pinus and Quercus increase. This may be due to a very recent plantation programme to re-afforest the region south of the Gorgan Plain. Also in the same zone, monolete and trilete spore percentages increase, illustrating the progressive infilling of the area by river sediment.
The dinocysts results for the top 660 cm are as follows (Fig. 6 and SI 6). In the last sample of zone TMd-4, at 660 cm (for the rest of this zone
see fig. SI 6), the percentages of I. caspienense dominate the spectrum. L. machaerophorum, i.e. form B and ss, co-occur. High values of Brig- antedinium sp. are observed. Relatively high values of S. cruciformis, 6–10%, are noted. In zone TMd-5, 623.5–370 cm, I. caspienense per- centages stabilise around 40–50%. L. machaerophorum B continues rising but more slowly. After a progressive increase, L. machaerophorum ss, culminating in a peak at 19%, suddenly drops to 1% from subzone 5a to 5b. A fall of Brigantedinium sp. is noted across this zone. The P/D ratio fluctuates but is falling. In the last sample of this zone, a peak of fora- minifera linings is observed, already present in low quantities from the base of zone 5a. Zone TMd-6, 370–20 cm, is characterised by a maximum of L. machaerophorum B (49%). While L. machaerophorum form B remains high, form ss remains low. Brigantedinium sp. are quasi absent. S. cruciformis is still present. The P/D ratio is low to very low. The reconstruction of the sea surface salinity for summer suggests during the interval between 660 and 535 cm, a SSSsummer of 12.5–12.7 psu, thus higher than later in the sequence, and a progressive return to current conditions of 12.3 psu at the depth of 20 cm (Fig. 6 and SI 7).
The interpretation of the top 660 cm of the TM sequence indicates an increased salinity in comparison to below this depth, with the maximum of SSSsummer at 660 and 535 cm and the progressive increase of L. machaerophorum ss up to a maximum of salinity at 460 cm (sample in the sand at 495–400 cm). The sand itself is a clear sign of emersion, a probable beach. This horizon contains many reworked elements. A shell taken close to its base indicates an age of cal 328–537 AD. Just above the sand comes the three dark clayey silt horizons attributed to lagoons.
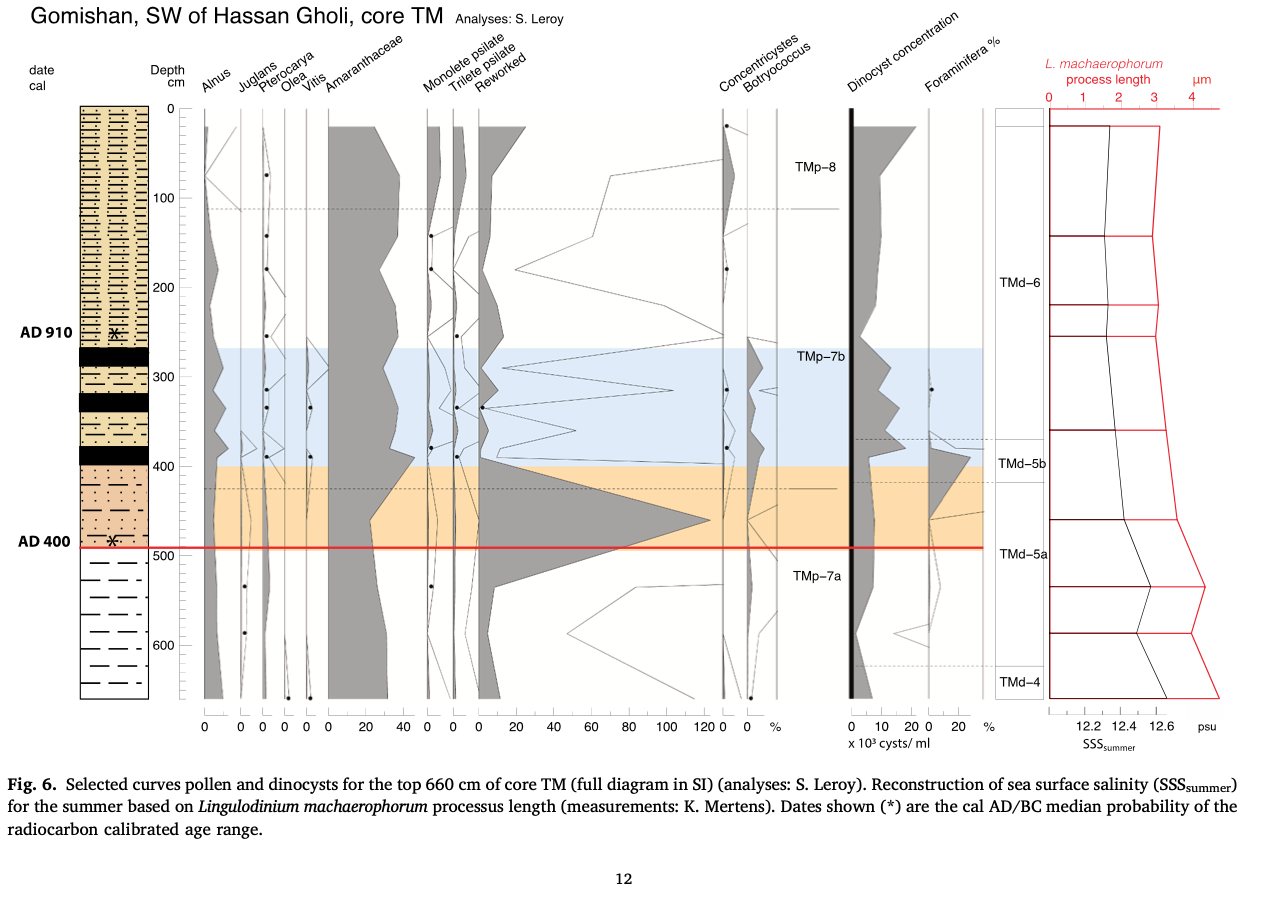
Only one sample was taken in it, which displays high values of forami- nifera. The last meters reflect the lagoon infilling locally. The increase in river indicators in the pollen and spore assemblages fit well with a slight decrease of SSSsummer.
3.4. Transects and radiocarbon dates from other places
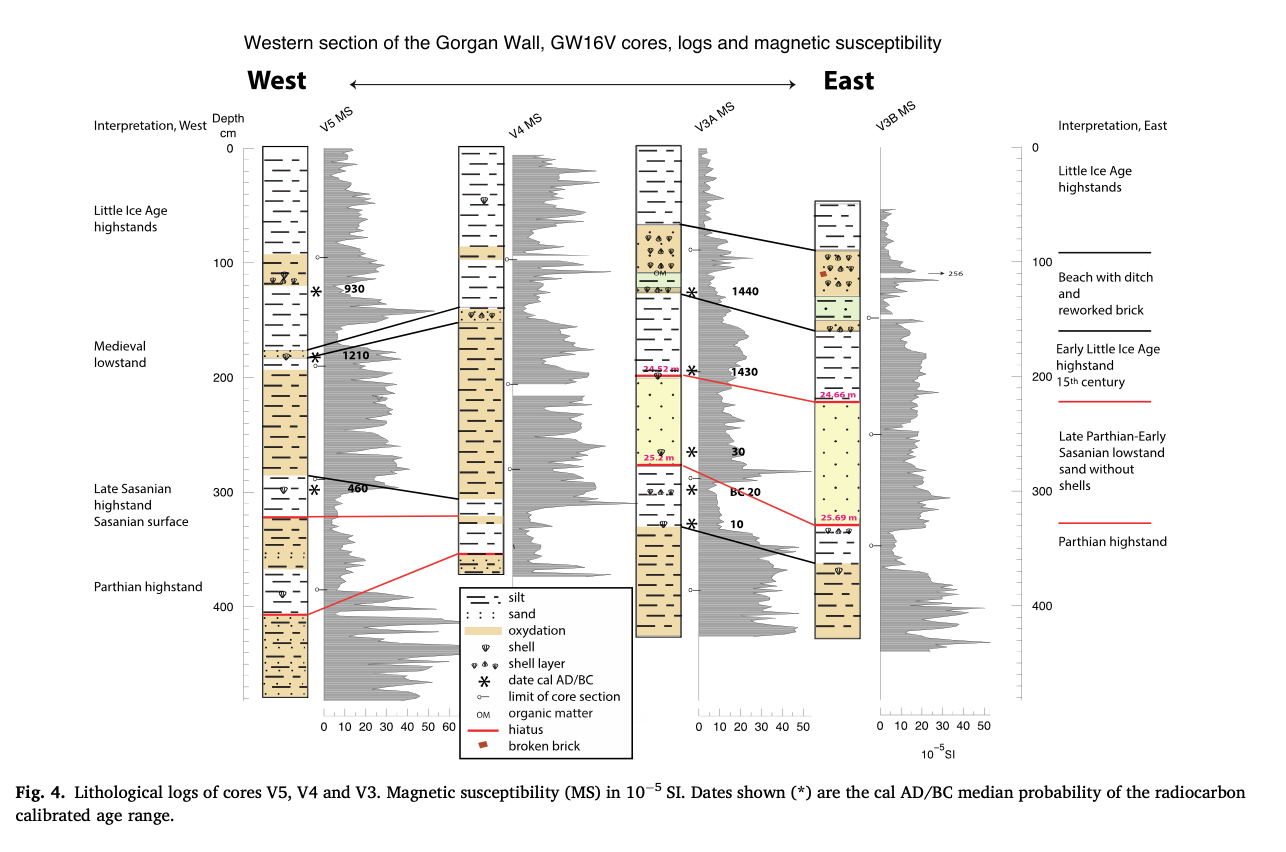
A west to east transect, reaching the westernmost known section of the Gorgan Wall consists of four cores, i.e. V5, V4 and V3A and B (Fig. 4). Visually, it is clear that the sand levels at 184–176 cm in core V5 and at 148–142 cm in core V4 correlate. The grey silt above a sharp lithological in core V5 at 323.5–298.5 cm correlate well to 321.5–308.5 cm in core V4. The correlation of the parallel cores V3A and V3B is clear owing to a thick sand layer devoid of shells around 300–200 cm depth dating to the Late Parthian-Early Sasanian lowstand and owing to a gully filled in with a lacustrine greenish silty clay around 120 cm depth dating from the 15th century (Leroy et al., 2022). It seems that the sediment deposition (lagoon facies) observed in core V5 between cal 348–550 AD and around the 9th to 13th century did not reach far inland, as absent in cores V3. In cores V3A and B, furthest inland, only high highstands are indeed recorded, i.e. before the Sasanian lowstand, most likely a highstand in the Parthian period (the age of the whole Parthian period is 247 BC to 224 AD) and a second highstand in the Little Ice Age (LIA).
A transect from the edges of the Gorgan Bay to the SW corner of the Hassan Gholi, passes through core V5 (Fig. 2). Based on lithological signs of hiatus and/or emersion, the Sasanian surface (the surface on which the walls were built; see Leroy et al., 2022) is located at 155 cm depth in core Gha, at 323.5 cm in core V5 and between 495 and 400 cm in core TM. The TM sand (corresponding to the Sasanian surface) is poorly dated at 328–537 AD and the return of water is dated immedi- ately afterwards at cal 348–550 AD in core V5.
Below the Sasanian surface, the sediment shows a period of high- stand with many fluctuations in cores Gha and V5, but more stable in core TM in the Hassan Gholi. After the Sasanian surface, several periods of highstands are noted.
The sites in the Hassan Gholi area (cores V5, V4, TM and cores C3 and C6 from Naderi Beni et al. (2013, 2014); Fig. 1c) indicate higher elevations than expected. This can be explained by the lagoon being at times separate from the Caspian Sea and influenced by the Atrek River and other freshwater inflow. These sites should therefore be discussed separately from CSL and are thus shown in blue and bold in Fig. 7 and Tables 4a and b. The sediment of core TM is oxidised from 495 cm up- wards suggesting shallow waters. A hiatus at 323.5 cm in core V5, already correlated in the transect with the sand of core TM. The group of dates (Fig. 7) shows that during the Sasanian lowstand and the Medieval period, the lagoon remained filled with water.
A lagoon and barrier complex has been studied in detail in Turali (Dagestan) with radiocarbon dates and precise elevations (Fig. 1b). Five dates (recalibrated) fall between 158 cal BC and cal 207 AD, for eleva- tions above the present, i.e. -24 to − 26.5 m (Kroonenberg et al., 2007) (Table 4b). One additional earlier date at 360–50 cal BC indicates slightly lower elevation at − 28 m (Kroonenberg et al., 2007) (Table 4b).
In Well 3 of the Kura Delta, a transgressive surface TS2 follows a shell-rich horizon (dated at 580 AD, median probability) interrupting massive clays and silts (Table 4b) (Fig. 1b). With the support of in- ferences from other cores in the same study, it was suggested that this lowstand reached − 42 to − 37 m (Hoogendoorn et al., 2005). This lowstand was attributed to the Derbent lowstand (Derbent in Russian, Darband in Persian) (Rychagov, 1997).
The Mazgah mire, along the coast, is a coastal wetland mostly iso- lated from the sea (Ramezani et al., 2016) (Fig. 1b). Tree leaves dated at 20 cm above a thin lagoonal horizon provided an age of 47 cal BC–cal 128 AD (Table 4b). The arguments for a lagoonal highstand are some indicators of changes from an alder carr to a slightly brackish environ- ment (e.g. with foraminifera) and slightly deeper water. This is followed by a progressive regression.
Cores taken in the Langarud wetland, > 11 km from the current coastline, contain a terrestrial record interrupted by a brackish level (dinoflagellate cysts in an otherwise terrestrial context; Haghani et al., 2016) (Fig. 1b). Three 14C dates suggest that the CSL rose to − 25 and to − 24.4 m in the 14th century and at the beginning of the 15th century respectively (Table 4b).
3.5. Geological data and Caspian Sea levels
Thirty radiocarbon dates (with error bars lower than ±50 yr) were collected in a rather restricted geographical area of 125 km W-E by 50 km N-S in the SE corner of the Caspian Sea (Table 4a; Fig. 7), to which another eleven dates from other areas may be added (Table 4b).
At the start of the Parthian period, a site indicates elevations around − 28 m (Turali) (Fig. 1b). In the middle of the Parthian period, quite clearly many sites suggest a highstand, with Bagho showing the highest elevations and largest penetration inland: − 22.06 m (Fig. 7, Table 4a and b). Then the water level falls relatively quickly, reaching perhaps already levels below the present before the end of the Parthian Period. In the Early Sasanian period, this fall probably carries on, we have no sites, except one in the Hassan Gholi at quite a low elevation. Clearly though in the mid-Sasanian period, the levels are very low. Hoogendoorn et al. (2005) have suggested that the level reached − 37 to − 42 m. But two caveats need to be taken in consideration: 1) the hiati in Well 3 and Piston Core 5 of the Kura Delta can be interpreted as an emersion feature below a transgressive surface (TS2) (coastal to onshore setting; Hoo- gendoorn et al., 2005), if a mass movement linked to a sea level drop can be excluded; and 2) a reasonable estimations of the water column is difficult to make at the scale necessary to fine-tune to historical evi- dences, as it is hard to distinguish between 5 and 10 and 15–15.5 m. At the end of the Late Sasanian period or shortly after, the levels re-increase abruptly and reach − 29 to − 28.5 m. In the Medieval period, hardly any geological information is available, perhaps due to low levels and absence of sedimentation along the coasts. One sample, at the end of this period in core L2A, shows a level at a minimum of − 28.1 m in cal 1149–1274 AD. In the early LIA, the levels have clearly re-increased as shown by several sites, reaching at least − 23.7 m. The increase might have been sharp at cal 1350 AD (median probability) as three sites spread from − 27.5 to − 23.9 m. Then the levels may have fallen again to − 27.3moreven− 28.5m.
3.4. Transects and radiocarbon dates from other places
A west to east transect, reaching the westernmost known section of the Gorgan Wall consists of four cores, i.e. V5, V4 and V3A and B (Fig. 4). Visually, it is clear that the sand levels at 184–176 cm in core V5 and at 148–142 cm in core V4 correlate. The grey silt above a sharp lithological in core V5 at 323.5–298.5 cm correlate well to 321.5–308.5 cm in core V4. The correlation of the parallel cores V3A and V3B is clear owing to a thick sand layer devoid of shells around 300–200 cm depth dating to the Late Parthian-Early Sasanian lowstand and owing to a gully filled in with a lacustrine greenish silty clay around 120 cm depth dating from the 15th century (Leroy et al., 2022). It seems that the sediment deposition (lagoon facies) observed in core V5 between cal 348–550 AD and around the 9th to 13th century did not reach far inland, as absent in cores V3. In cores V3A and B, furthest inland, only high highstands are indeed recorded, i.e. before the Sasanian lowstand, most likely a highstand in the Parthian period (the age of the whole Parthian period is 247 BC to 224 AD) and a second highstand in the Little Ice Age (LIA).
A transect from the edges of the Gorgan Bay to the SW corner of the Hassan Gholi, passes through core V5 (Fig. 2). Based on lithological signs of hiatus and/or emersion, the Sasanian surface (the surface on which the walls were built; see Leroy et al., 2022) is located at 155 cm depth in core Gha, at 323.5 cm in core V5 and between 495 and 400 cm in core TM. The TM sand (corresponding to the Sasanian surface) is poorly dated at 328–537 AD and the return of water is dated immedi- ately afterwards at cal 348–550 AD in core V5.
Below the Sasanian surface, the sediment shows a period of high- stand with many fluctuations in cores Gha and V5, but more stable in core TM in the Hassan Gholi. After the Sasanian surface, several periods of highstands are noted.
The sites in the Hassan Gholi area (cores V5, V4, TM and cores C3 and C6 from Naderi Beni et al. (2013, 2014); Fig. 1c) indicate higher elevations than expected. This can be explained by the lagoon being at times separate from the Caspian Sea and influenced by the Atrek River and other freshwater inflow. These sites should therefore be discussed separately from CSL and are thus shown in blue and bold in Fig. 7 and Tables 4a and b. The sediment of core TM is oxidised from 495 cm up- wards suggesting shallow waters. A hiatus at 323.5 cm in core V5, already correlated in the transect with the sand of core TM. The group of dates (Fig. 7) shows that during the Sasanian lowstand and the Medieval period, the lagoon remained filled with water.
A lagoon and barrier complex has been studied in detail in Turali (Dagestan) with radiocarbon dates and precise elevations (Fig. 1b). Five dates (recalibrated) fall between 158 cal BC and cal 207 AD, for eleva- tions above the present, i.e. -24 to − 26.5 m (Kroonenberg et al., 2007) (Table 4b). One additional earlier date at 360–50 cal BC indicates slightly lower elevation at − 28 m (Kroonenberg et al., 2007) (Table 4b).
In Well 3 of the Kura Delta, a transgressive surface TS2 follows a shell-rich horizon (dated at 580 AD, median probability) interrupting massive clays and silts (Table 4b) (Fig. 1b). With the support of in- ferences from other cores in the same study, it was suggested that this lowstand reached − 42 to − 37 m (Hoogendoorn et al., 2005). This lowstand was attributed to the Derbent lowstand (Derbent in Russian, Darband in Persian) (Rychagov, 1997).
The Mazgah mire, along the coast, is a coastal wetland mostly iso- lated from the sea (Ramezani et al., 2016) (Fig. 1b). Tree leaves dated at 20 cm above a thin lagoonal horizon provided an age of 47 cal BC–cal 128 AD (Table 4b). The arguments for a lagoonal highstand are some indicators of changes from an alder carr to a slightly brackish environ- ment (e.g. with foraminifera) and slightly deeper water. This is followed by a progressive regression.
Cores taken in the Langarud wetland, > 11 km from the current coastline, contain a terrestrial record interrupted by a brackish level (dinoflagellate cysts in an otherwise terrestrial context; Haghani et al., 2016) (Fig. 1b). Three 14C dates suggest that the CSL rose to − 25 and to − 24.4 m in the 14th century and at the beginning of the 15th century respectively (Table 4b).
3.5. Geological data and Caspian Sea levels
Thirty radiocarbon dates (with error bars lower than ±50 yr) were collected in a rather restricted geographical area of 125 km W-E by 50 km N-S in the SE corner of the Caspian Sea (Table 4a; Fig. 7), to which another eleven dates from other areas may be added (Table 4b).
At the start of the Parthian period, a site indicates elevations around − 28 m (Turali) (Fig. 1b). In the middle of the Parthian period, quite clearly many sites suggest a highstand, with Bagho showing the highest elevations and largest penetration inland: − 22.06 m (Fig. 7, Table 4a and b). Then the water level falls relatively quickly, reaching perhaps already levels below the present before the end of the Parthian Period. In the Early Sasanian period, this fall probably carries on, we have no sites, except one in the Hassan Gholi at quite a low elevation. Clearly though in the mid-Sasanian period, the levels are very low. Hoogendoorn et al. (2005) have suggested that the level reached − 37 to − 42 m. But two caveats need to be taken in consideration: 1) the hiati in Well 3 and Piston Core 5 of the Kura Delta can be interpreted as an emersion feature below a transgressive surface (TS2) (coastal to onshore setting; Hoo- gendoorn et al., 2005), if a mass movement linked to a sea level drop can be excluded; and 2) a reasonable estimations of the water column is difficult to make at the scale necessary to fine-tune to historical evi- dences, as it is hard to distinguish between 5 and 10 and 15–15.5 m. At the end of the Late Sasanian period or shortly after, the levels re-increase abruptly and reach − 29 to − 28.5 m. In the Medieval period, hardly any geological information is available, perhaps due to low levels and absence of sedimentation along the coasts. One sample, at the end of this period in core L2A, shows a level at a minimum of − 28.1 m in cal 1149–1274 AD. In the early LIA, the levels have clearly re-increased as shown by several sites, reaching at least − 23.7 m. The increase might have been sharp at cal 1350 AD (median probability) as three sites spread from − 27.5 to − 23.9 m. Then the levels may have fallen again to − 27.3moreven− 28.5m.
4. Part 2: Archaeo-historical data
4.1. Introduction
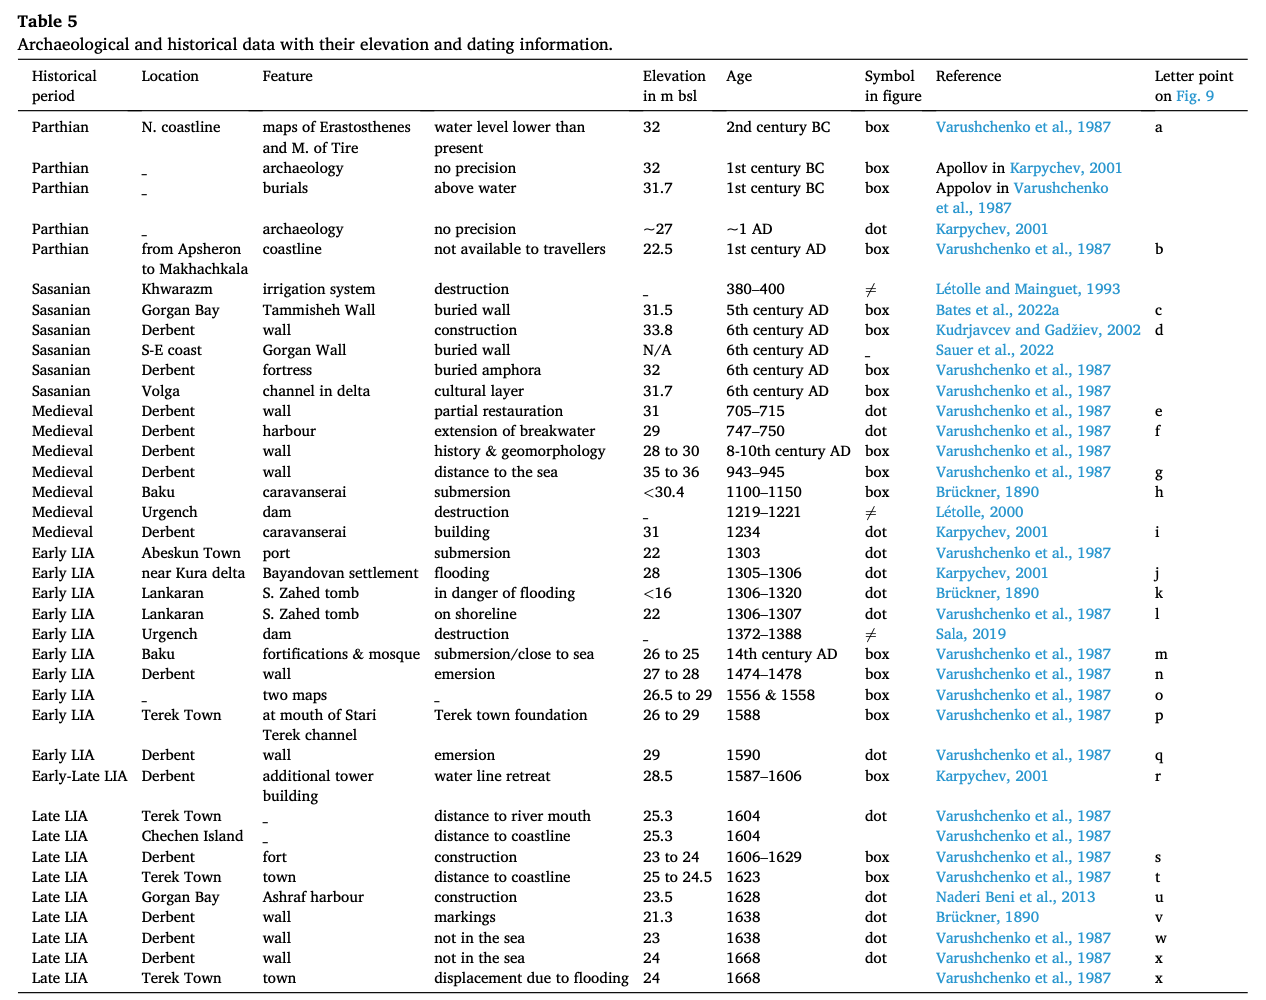
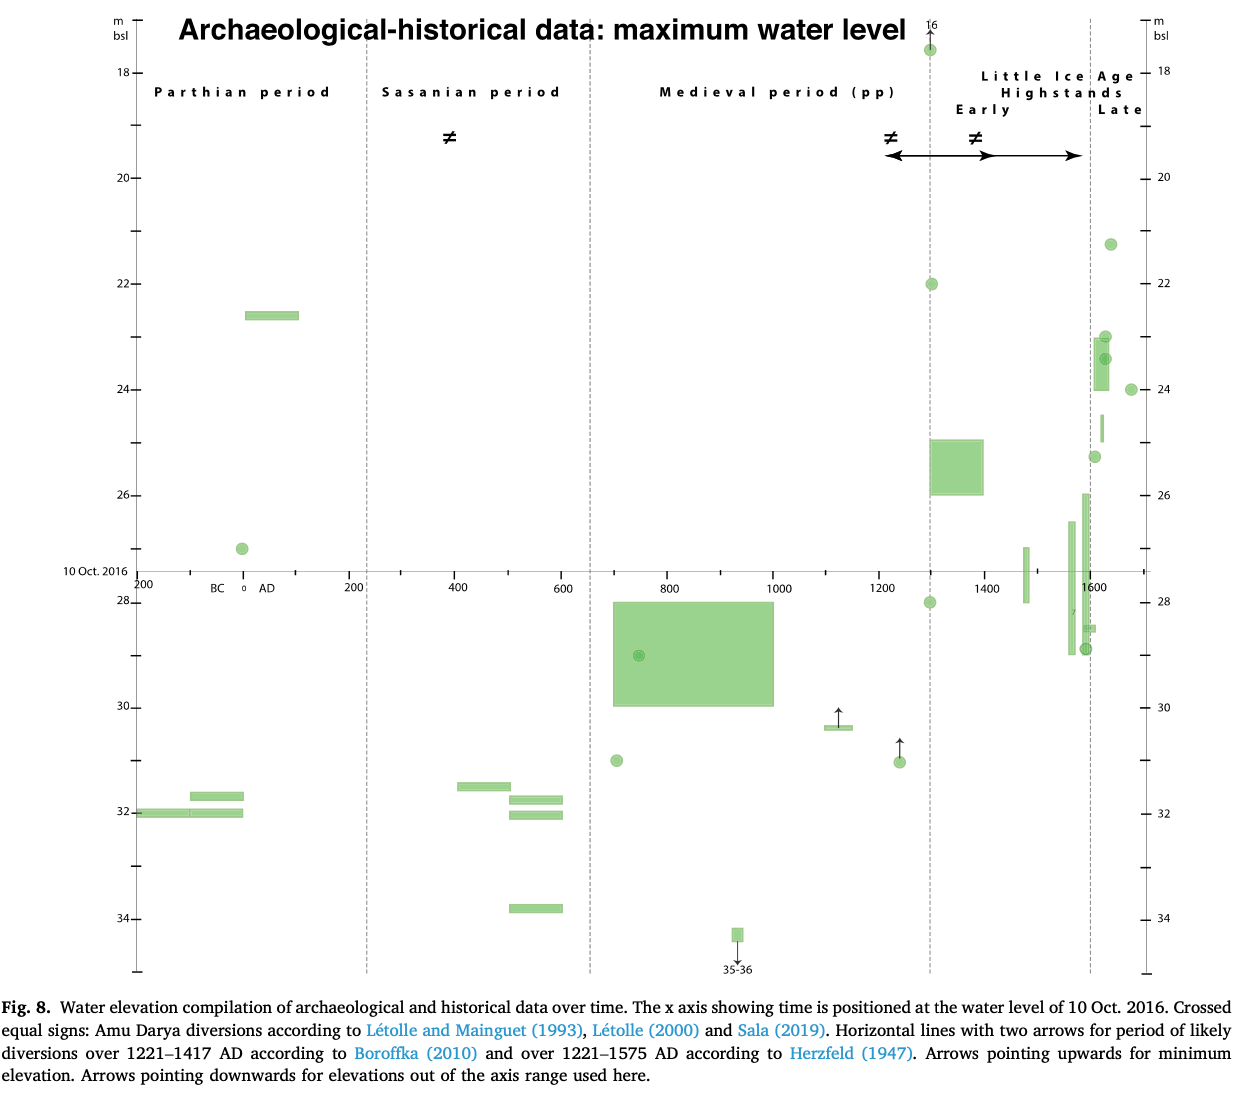
Over 35 historical datapoints (Table 5 and Fig. 8) were used; they were taken from the 2013 curve (Naderi Beni et al., 2013), verified one by one and completed by additional reading.
The last 2200 years are divided in four periods. Two periods are named here according to Persian history, i.e. Parthian (247 BC to 224 AD) and Sasanian (224 AD to 651) periods because, for a large part of the time concerned, the south Caspian basin, including up to part of Dagestan (Middle basin of the Caspian Sea), was under the dominion of Persia. Then the “Medieval” term is used, corresponding to the Arab Conquest, in preference to the Derbent period (see discussion). Strictly speaking from a historical point of view, the Medieval period extends from 651 AD to 1500. However, for practical reasons, in the Medieval section, we only discuss the points until 1300 AD, i.e. the starting date of the LIA in its extensive definition. Finally, the name of a climatic phase is used for the last centuries, i.e. the early and late Little Ice Age. At a global scale, a wide definition of the LIA gives its start at 1300 AD (Mann, 2002; Mann et al., 2009). Moreover, we divide the LIA in early LIA, i.e. at 1300–1600 AD and in late LIA at AD1600–1850.
4.1. Introduction
Over 35 historical datapoints (Table 5 and Fig. 8) were used; they were taken from the 2013 curve (Naderi Beni et al., 2013), verified one by one and completed by additional reading.
The last 2200 years are divided in four periods. Two periods are named here according to Persian history, i.e. Parthian (247 BC to 224 AD) and Sasanian (224 AD to 651) periods because, for a large part of the time concerned, the south Caspian basin, including up to part of Dagestan (Middle basin of the Caspian Sea), was under the dominion of Persia. Then the “Medieval” term is used, corresponding to the Arab Conquest, in preference to the Derbent period (see discussion). Strictly speaking from a historical point of view, the Medieval period extends from 651 AD to 1500. However, for practical reasons, in the Medieval section, we only discuss the points until 1300 AD, i.e. the starting date of the LIA in its extensive definition. Finally, the name of a climatic phase is used for the last centuries, i.e. the early and late Little Ice Age. At a global scale, a wide definition of the LIA gives its start at 1300 AD (Mann, 2002; Mann et al., 2009). Moreover, we divide the LIA in early LIA, i.e. at 1300–1600 AD and in late LIA at AD1600–1850.
4.2. Relevance of the Amu Darya lower reaches
For the reconstruction of CSL, it is important to look at what happened in the Amu Darya and Syr Darya deltas. The Amu Darya has been called a Caspian river by some, as, over its existence, it has flowed mostly to the Caspian Sea. Artificial irrigation has been practiced in the Khwarazm (Chorasmia) between Amu Darya and Syr Darya for a very long time. It developed quite extensively with some very large earthen dam building at least since the 6th century BC when Khwarazm became part of the Persian empire (Ĺetolle, 2000; Boroffka, 2010). The main river flow of the Amu Darya (left branch in Urgench, the right one still going to the Aral Sea) was diverted to the Sarykamish Lake (at a much lower elevation than the Aral Sea; Herzfeld, 1947) and from there to the Caspian Sea via the Uzboy River (Fig. 1a). Herzfeld (1947) indicates that the idea of artificial river diversion is extremely old. In the 3rd century BC, Patrocles, a Greek military man and engineer, was sent to the Urgench region to explore the possibility of a commercial route between the Black Sea and India. This also indicates that the Amu Darya was connected to Caspian Sea at that time (Herzfeld, 1947). There are at least two mentions of the Uzboy being possibly navigable by ships: in the 4th century BC by Aristobolus, a historian and companion on Alexander the Great campaigns, although some confusion with the Sarykamish or other seas/lakes cannot be excluded (Thorley, 1969) and in 1392 AD and following decades by several authors (L ́etolle, 2000; Boroffka, 2010). Historical documents also pinpoint that between the 10th and the
13th centuries, the Uzboy had no water because of a major dam built on the main feeding arm to the Sarykamish (Gloukhovskoy, 1893).
The hypothesis that river diversion could strictly be caused by human mediation (for benefit or by war) has however been challenged by Toonen et al. (2020), and a climatic contribution has been high- lighted (see climatic discussion below). In any case, in addition to di- versions, dams create vulnerabilities not only to potential enemy attacks but also to natural hazards (such as earthquakes), which may cause sudden dam breaches.
4.3. Parthian Period
From Varushchenko et al. (1987) and Karpychev (2001), we learn that the CSL in the second and first centuries BC was below the mark of − 32m;thisisbasedonarchaeologicaldata.However,2000yearsago,it is likely that the sea level was not higher than it is now (Karpychev, 2001). In the first century AD, the coast between Apsheron and Makhachkala (Dagestan) was flooded becoming unavailable to travel- lers,thusaCSLof− 22.5mwassuggested(Fig.1b)(Varushchenkoetal., 1987).
4.4. Sasanian Period
According to Dimishqui, the town of Abeskun, a famous ancient trade centre at the SE corner of the Caspian Sea, was founded by king Kavad I (488–531 AD; this is a revised and more correct date than that cited by Varushchenko et al. (1987)), and is likely to be the successor of the more ancient town of Socanda, attested by Ptolemy and Ammianus Marcellinus in the 2nd and 4th centuries AD (Sauer et al., 2013). It has been proposed that it corresponds to modern-day Gomish Tappeh near Gomishan but location of the town and/or its harbour may have shifted repeatedly and may have been in the 5th–6th centuries in an area now offshore of Gomishan, when the CSL were low (Varushchenko et al., 1987; Zonn et al., 2010; Naderi Beni et al., 2013; Sauer et al., 2013) (Fig. 1b). So, although relatively well documented, the absence of ele- vations hinders its use for CSL reconstruction.
The renowned Sasanian walls, i.e. the Gorgan (>170 km long) and Tammisheh (>12 km long) Walls in Iran, were built to protect the southern farmers from the northerners (especially the Hephthalites or White Huns). One of the long walls, the wall of Tammisheh, ends in the Gorgan Bay (Fig. 1). It carries on below the current water level and was built, as the other ones, around the 5-6th century AD when the water level was lower than present around − 32 to − 31.5 m (Nokandeh et al., 2006) (Table 4b). The Tammisheh Wall, if the terminus was indeed found, ended on the then shoreline or abutting the thalweg of the Qareh Su (a west-east river at the same latitude) (Leroy et al., 2022). Given the
shallow gradient and the lack of stone, it would have been impossible to continue it to 2 m water depth (Sauer et al., 2013). The Derbent Wall (Dagestan) was built around the 6th century and also has a terminus below current water level (Kudrjavcev and Gadˇziev, 2002). Interestingly the Derbent Wall (built on a slope) terminates around 2 m below the 6th- century water level to make bypassing it impossible. A buried layer with cultural artefacts found in the Volga Delta at − 31.7 m completes the picture (Varushchenko et al., 1987).
L ́etolle and Mainguet (1993) evoke the possibility of hydraulic infrastructure (including dams) destruction in northern Turkmenistan by Huns (not Hephthalite) in 380–400 AD. However, the impact on the Amu Darya on the CSL must has remained minor. The date certainly does not fit the chronology of the Derbent and Tammisheh Wall flooding (see below), nor does it fit the geological data collected around the Caspian Sea.
4.5. Medieval Period (pro parte)
Abundant information is derived from observations on the Derbent Wall and Derbent caravanserai as well as a caravanserai in Baku, such as distance to the sea, destruction by the sea or construction of additional buildings (Table 5).
The then resplendent town of Gurganj (Kunya Urgench in Khwar-
azm) and related irrigation infrastructure were often destroyed during wars (Fig. 1a). For example, Genghis Khan's army (led by his sons) fought in 1219–1221 AD and in an act of revenge caused a lot of destruction, including that of a major dam built in the 10th century on the Amu Darya (L ́etolle, 2000; Naderi Beni et al., 2013). The river waters ran into the Uzboy, reached the Caspian Sea and caused a well- documented temporary increase of the water level by ~7 to 9 m (Herzfeld, 1947; Naderi Beni et al., 2013; Krivonogov et al., 2014).
4.6. The early and late Little Ice Age
Abeskun was an important coastal town until 1303–1304 AD (early LIA) when its harbour was swallowed by the Caspian Sea. It became an island and finally disappeared below the water (Varushchenko et al., 1987; Naderi Beni et al., 2013). Also in these more recent times, no elevation points are available. More relevant information is derived from the tomb of Sheik Zahed in Lankaran, fortifications in Baku, flooding of a settlement near the Kura delta, changes to the Derbent Wall and observations on the position of the town of Terek in the Terek Delta (see Table 5; Fig. 1b).
A renewed and final destruction of Urgench and of a major dam by the Timurid Mongols (1372–1388 AD) may have contributed to high levels in the Caspian Sea (L ́etolle and Mainguet, 1993).
In the late LIA, information is provided by observations in Derbend and Terek, in addition to the appearance/disappearance of islands. The remains of an old port, i.e. the Ashraf Port, of the Safavid era (1501–1722 AD) constructed in 1628 AD were found at an altitude of − 23.5 m in the plain of Behshahr (Naderi Beni et al., 2013), reflecting higher than present CSL. The harbour was connected to the then known world through the Royal Road and the Silk Road (Nadim and Zahedi, 2018).
5. Part 3: Discussion
5.1. An updated water level curve
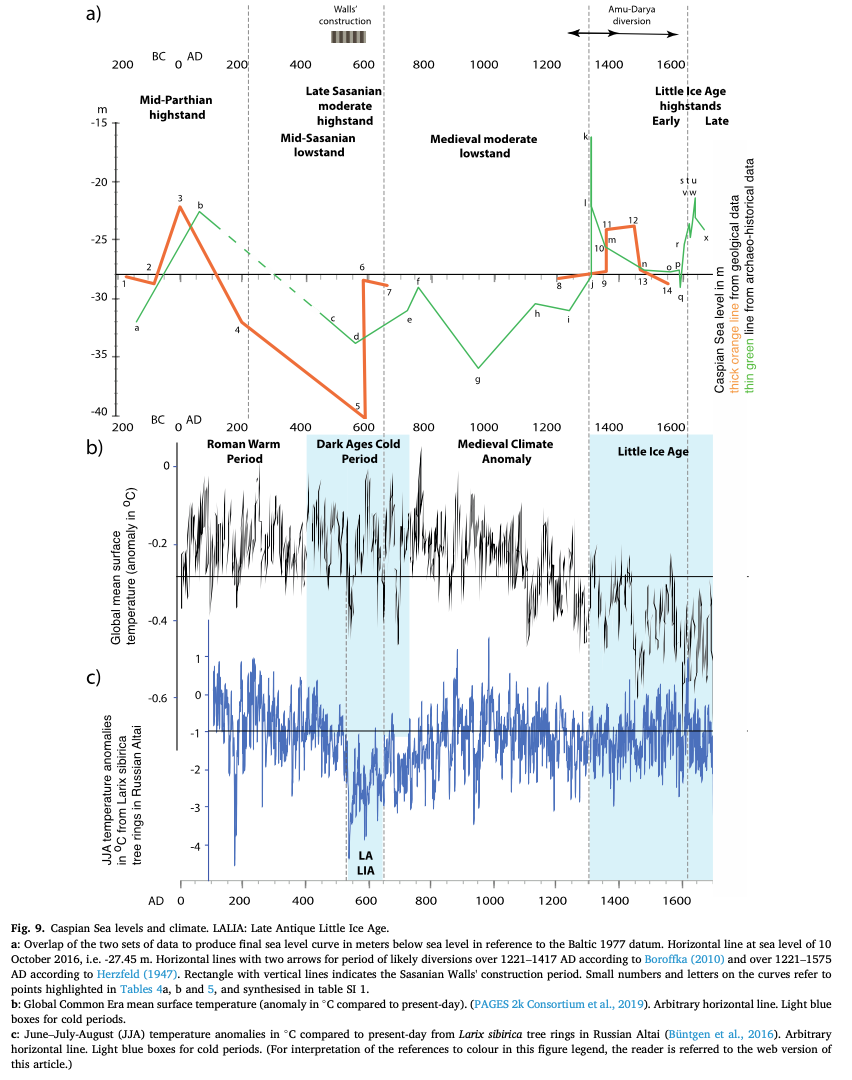
Here we juxtapose the results from our two previous compilations, i. e. geological data set and archaeo-historical data set, in order to derive a new robust and more complete CSL for the last 2200 years. Their joint distribution over time reveals a series of similar low and highstands (Fig. 9a, SI 8 and table SI 1). The small numbers on Fig. 9a allow linking to points chosen in Tables 4 and 5. Often, but far from always, the geological data are lower than the archaeo-historical data as, as underlined earlier, the geological data indicate a minimal elevation, and the archaeological ones provide an upper limit. It has been necessary to treat separately the data from the Hassan Gholi as their elevation values were generally higher. This can be explained by the usually higher elevation of the water body with regard to the Caspian Sea, owing to a different water balance. One has to recognise however that 1) sediment compaction has played a role, affecting increasingly more sediment as it gets older; and 2) seismic movements have affected both sets of data, upwards and downwards (for the latter see discussion in Section 5.3.1). Highstands and lowstands are identified in relation to present-day water levels shown in Figs. 7 and 8 as the x axis.
5.1.1. The mid-Parthian highstand
During this period, a brief highstand but very well illustrated at ca >50 BC to ca AD >50 by geological data in multiple sites around the Caspian Sea and by historical signs of flooding around the western coast. The highest points are at the Bagho outcrop at − 22.06 m, and along the western coast at ~-22.5 m.
This is preceded by a poorly documented lowstand and followed by another lowstand. Old maps in the 2nd and 1st century BC, burials in the 1st century BC indicate low levels, perhaps as low as − 32 m. A radiocarbon-dated point in core L1A belongs probably to this lowstand. Towards the end of the Parthian period, the level falls anew. It is only shown by dates in cores Gha and C2, suggesting − 32 m at 180 AD.
5.1.2. The mid-Sasanian lowstand
The Sasanian period starts with a lack of data over ~270 years (between 180 AD to 450). By integrating levels before and after this long period, one may suggest, with caution, falling levels. Some evidence suggests then very low levels: 1) Tammisheh Wall in the 5th century AD, its likely terminus being at ca − 31.5 m (Bates et al., 2022a) and 2) the initial construction of the Derbent Wall in the 6th century, terminating at − 33.8 m, its mortar-less construction beneath − 32 m suggesting that it continued into the sea beyond the then water level of − 31.5 to − 32 m (Kudrjavcev and Gadˇziev, 2002). These very low levels may be related to the TS2 hiatus found in the Kura delta core at − 42 to − 37 m (depths pending caveats above-mentioned) dated by a radiocarbon date with a wide age range at cal 436–651 AD. These data indicate a dramatic water level fall in comparison to the Parthian highstand, by at least 11 m (archaeological data), or perhaps even more (geological data); this is the mid-Sasanian lowstand. The Sasanian surface has been crossed by several sediment cores in the Gorgan Bay. Their study confirmed the CSL at the time of the Tammisheh Wall terminus construction at − 31.5 to − 32 m (Leroy et al., 2022). The lowstand may have led to a situation when large land expanses (due to the shallow underwater slope) were suddenly emerged and vulnerable to northern invasions.
Hassan Gholi, a water body to the north of the Gorgan Wall, was several meters higher than the Caspian Sea. The movement of its shoreline would have affected the western terminus of the Gorgan Wall. It explains why three diverging walls appear in the western section of the wall (Bates et al., 2022b).
Ifweacceptthedepthof− 32minthelate5thandinthe6thcen- turies, it seems that the walls and their termini were built when the sea level was already re-increasing and certainly not decreasing (see next section), otherwise the wall termini would have been found at an even lower elevation.
5.1.3. The Late Sasanian or early post-Sasanian moderate highstand
The Late Sasanian or early post-Sasanian highstand was of moderate amplitude, i.e. ~-28.5 to − 29 m, thus slightly below current water level. But it was high enough to flood the lower parts of the walls. Evidence comes from two levels in cores L1A and L2A from the Gorgan Bay. It seems to have occurred at some stage between the 6th and the 8th century AD, i.e. towards the end of the Sasanian era or in the early post- Sasanian era.
5.1.4. The medieval moderate lowstand
This long lowstand (>600 years) is not well illustrated in the geological data: i.e. two points, one at the very start at − 29 m and to- wards the end at − 29 m again. Three data points from Hassan Gholi are just below current sea levels.
The lowstand is proposed here mostly on the base of historical data. It is hard to decide if the lowstand is limited to the depth of − 31 to − 28 m,ortheverylowvaluesof− 35to− 36mat943–945ADshouldbe accepted. The latter is based on the distance to the sea of the Derbent Wall. The tenth century is also the period of the main dam building on the Amu Darya, thus not allowing a water flow towards the Sarykamish anymore. In general, a paucity of evidence for a very low level in the Medieval times thus invites caution.
5.1.5. The LIA highstands
The early LIA highstand is illustrated by more than seven dates here and many historical observations. It starts by an extremely high-water level, perhaps as high as 16 m, if the flooding of Sheik Zahed tomb is to be considered at 1306–1320 AD. Other historical information seems to support a peak at least until − 22 m at 1303–1307 AD in the Kura delta and Lankaran. Then the level remained higher than present close to − 26 to − 25 m in the 14th century as seen from a range of evidence in Baku (tower wall flooded and sea approaching the mosque). Several geolog- ical data indicate a clear peak a little later (between cal 1350 AD and 1440, median probabilities) at − 23.7 to − 23.9 m, this includes the flooding the western terminus of the Gorgan Wall (as seen by the flooding of a kiln), but certainly linked to the more precisely historically- dated peak of 1303–1307 AD. This followed by a progressive fall to − 29 m in 1590 AD.
In the late LIA, radiocarbon dates are not used, as the limit of their meaningful application is reached. According to historical observations, the level re-increases abruptly to reach − 21.3 m at 1638 AD. In 1668 AD, several authors agree to show that the level has fallen back slightly to− 24m.
5.1.6. Amplitude and rates of changes
Over the last 2200 years, based on geological data, a conservative amplitude of CSL changes of 8.2 m may be proposed between 1440 AD (core V3A) and 180 AD (core C2), although extremes between the Bagho point and Well 3 horizon in the Kura delta may perhaps suggest that the amplitude could reach a much higher value up to 18 m. Based on archaeo-historical data, a conservative evaluation provides 14.7 m be- tween 1638 AD and two low points at 943–945 AD, and an extreme of 20 m if the highest point in 1306–1320 AD is accepted. Therefore, the investigations over the last 2200 years by including the very low levels in the Late Sasanian period allow highlighting an amplitude of changes much larger that seen by analysing the last millennium only (Naderi Beni et al., 2013), and at least five times larger than that of the last century. This should then feed into mitigation plans for the future.
Although a denser number of data points all along the investigated time interval would be needed to evaluate rate of changes, some periods seem to have been affected by rapid changes. This is the case for three apparent floodings: 1) at the end of the Sasanian period, 2) in 1303–1307 AD and 3) at the beginning of the 17th century. For example, for the relatively well-documented 17th century, the rise of 6.6 m be- tween 1590 AD and 1638 occurred at an average rate of change of 14 cm per year. This is more than during the recent increase: 10.7 cm per year between 1977 and 1995 (Arpe et al., 2020).
highstand. The next older date at a high level (point 22 at − 21.5 m in Turali) is at 1160 cal BC (median probability), thus clearly older than a supposed “2600 yr BP highstand”. Therefore, the data most commonly used to define this “2600 yr BP highstand” are now in the Parthian highstand and no data exist in Kroonenberg et al. (2007) and Varush- chenko et al. (1987) for this period showing a highstand, when the dates are respectively re-calibrated or calibrated. Therefore, this highstand could not be documented here despite in-depth literature search, although it may perhaps otherwise exist.
5.2.2. What of the Derbent regression?
A problem of terminology exists for this period. The name “Derbent regression” or “Derbent lowstand” is generally attributed to the Medi- eval period but actually seems to refer to two distinct times, both times of lowstands. Some investigations report it at 580–600 AD (Varush- chenko et al., 1987; Klige and Myagkov, 1992; Hoogendoorn, 2006;Kroonenberg et al., 2008) whereas other investigations report it at 1000–1200 AD (Karpychev, 2001; Svitoch, 2012). No stratotype has been defined. The most recent age attribution is the only that justifies calling the Derbent Regression a Medieval regression, as the first one falls in the Sasanian period of Late Antiquity. In some cases, the two lowstands are somewhat blurred together (Rychagov, 1997). It seems however more logical to call the earlier period only the Derbent Regression as this is when the initial wall was built in the Sasanian period, and to avoid using the term Medieval. We recommend thus here to keep away from this appellation or at least call for caution in its usage with clear age precision.
5.2.3. Comparison to the 2013 curve
In comparison to the curve of 2013 (Naderi Beni et al., 2013) starting in the Medieval period, the main difference in the present curve is the much lower water level obtained before 1303–1307 AD. This is mainly due to the rejection of the Brückner date at 915–921 AD based on ob- servations on the Derbent Wall that has probably been reconstructed since, after several earthquakes and coastal subsidence (Brückner, 1890).
5.1. An updated water level curve
Here we juxtapose the results from our two previous compilations, i. e. geological data set and archaeo-historical data set, in order to derive a new robust and more complete CSL for the last 2200 years. Their joint distribution over time reveals a series of similar low and highstands (Fig. 9a, SI 8 and table SI 1). The small numbers on Fig. 9a allow linking to points chosen in Tables 4 and 5. Often, but far from always, the geological data are lower than the archaeo-historical data as, as underlined earlier, the geological data indicate a minimal elevation, and the archaeological ones provide an upper limit. It has been necessary to treat separately the data from the Hassan Gholi as their elevation values were generally higher. This can be explained by the usually higher elevation of the water body with regard to the Caspian Sea, owing to a different water balance. One has to recognise however that 1) sediment compaction has played a role, affecting increasingly more sediment as it gets older; and 2) seismic movements have affected both sets of data, upwards and downwards (for the latter see discussion in Section 5.3.1). Highstands and lowstands are identified in relation to present-day water levels shown in Figs. 7 and 8 as the x axis.
5.1.1. The mid-Parthian highstand
During this period, a brief highstand but very well illustrated at ca >50 BC to ca AD >50 by geological data in multiple sites around the Caspian Sea and by historical signs of flooding around the western coast. The highest points are at the Bagho outcrop at − 22.06 m, and along the western coast at ~-22.5 m.
This is preceded by a poorly documented lowstand and followed by another lowstand. Old maps in the 2nd and 1st century BC, burials in the 1st century BC indicate low levels, perhaps as low as − 32 m. A radiocarbon-dated point in core L1A belongs probably to this lowstand. Towards the end of the Parthian period, the level falls anew. It is only shown by dates in cores Gha and C2, suggesting − 32 m at 180 AD.
5.1.2. The mid-Sasanian lowstand
The Sasanian period starts with a lack of data over ~270 years (between 180 AD to 450). By integrating levels before and after this long period, one may suggest, with caution, falling levels. Some evidence suggests then very low levels: 1) Tammisheh Wall in the 5th century AD, its likely terminus being at ca − 31.5 m (Bates et al., 2022a) and 2) the initial construction of the Derbent Wall in the 6th century, terminating at − 33.8 m, its mortar-less construction beneath − 32 m suggesting that it continued into the sea beyond the then water level of − 31.5 to − 32 m (Kudrjavcev and Gadˇziev, 2002). These very low levels may be related to the TS2 hiatus found in the Kura delta core at − 42 to − 37 m (depths pending caveats above-mentioned) dated by a radiocarbon date with a wide age range at cal 436–651 AD. These data indicate a dramatic water level fall in comparison to the Parthian highstand, by at least 11 m (archaeological data), or perhaps even more (geological data); this is the mid-Sasanian lowstand. The Sasanian surface has been crossed by several sediment cores in the Gorgan Bay. Their study confirmed the CSL at the time of the Tammisheh Wall terminus construction at − 31.5 to − 32 m (Leroy et al., 2022). The lowstand may have led to a situation when large land expanses (due to the shallow underwater slope) were suddenly emerged and vulnerable to northern invasions.
Hassan Gholi, a water body to the north of the Gorgan Wall, was several meters higher than the Caspian Sea. The movement of its shoreline would have affected the western terminus of the Gorgan Wall. It explains why three diverging walls appear in the western section of the wall (Bates et al., 2022b).
Ifweacceptthedepthof− 32minthelate5thandinthe6thcen- turies, it seems that the walls and their termini were built when the sea level was already re-increasing and certainly not decreasing (see next section), otherwise the wall termini would have been found at an even lower elevation.
5.1.3. The Late Sasanian or early post-Sasanian moderate highstand
The Late Sasanian or early post-Sasanian highstand was of moderate amplitude, i.e. ~-28.5 to − 29 m, thus slightly below current water level. But it was high enough to flood the lower parts of the walls. Evidence comes from two levels in cores L1A and L2A from the Gorgan Bay. It seems to have occurred at some stage between the 6th and the 8th century AD, i.e. towards the end of the Sasanian era or in the early post- Sasanian era.
5.1.4. The medieval moderate lowstand
This long lowstand (>600 years) is not well illustrated in the geological data: i.e. two points, one at the very start at − 29 m and to- wards the end at − 29 m again. Three data points from Hassan Gholi are just below current sea levels.
The lowstand is proposed here mostly on the base of historical data. It is hard to decide if the lowstand is limited to the depth of − 31 to − 28 m,ortheverylowvaluesof− 35to− 36mat943–945ADshouldbe accepted. The latter is based on the distance to the sea of the Derbent Wall. The tenth century is also the period of the main dam building on the Amu Darya, thus not allowing a water flow towards the Sarykamish anymore. In general, a paucity of evidence for a very low level in the Medieval times thus invites caution.
5.1.5. The LIA highstands
The early LIA highstand is illustrated by more than seven dates here and many historical observations. It starts by an extremely high-water level, perhaps as high as 16 m, if the flooding of Sheik Zahed tomb is to be considered at 1306–1320 AD. Other historical information seems to support a peak at least until − 22 m at 1303–1307 AD in the Kura delta and Lankaran. Then the level remained higher than present close to − 26 to − 25 m in the 14th century as seen from a range of evidence in Baku (tower wall flooded and sea approaching the mosque). Several geolog- ical data indicate a clear peak a little later (between cal 1350 AD and 1440, median probabilities) at − 23.7 to − 23.9 m, this includes the flooding the western terminus of the Gorgan Wall (as seen by the flooding of a kiln), but certainly linked to the more precisely historically- dated peak of 1303–1307 AD. This followed by a progressive fall to − 29 m in 1590 AD.
In the late LIA, radiocarbon dates are not used, as the limit of their meaningful application is reached. According to historical observations, the level re-increases abruptly to reach − 21.3 m at 1638 AD. In 1668 AD, several authors agree to show that the level has fallen back slightly to− 24m.
5.1.6. Amplitude and rates of changes
Over the last 2200 years, based on geological data, a conservative amplitude of CSL changes of 8.2 m may be proposed between 1440 AD (core V3A) and 180 AD (core C2), although extremes between the Bagho point and Well 3 horizon in the Kura delta may perhaps suggest that the amplitude could reach a much higher value up to 18 m. Based on archaeo-historical data, a conservative evaluation provides 14.7 m be- tween 1638 AD and two low points at 943–945 AD, and an extreme of 20 m if the highest point in 1306–1320 AD is accepted. Therefore, the investigations over the last 2200 years by including the very low levels in the Late Sasanian period allow highlighting an amplitude of changes much larger that seen by analysing the last millennium only (Naderi Beni et al., 2013), and at least five times larger than that of the last century. This should then feed into mitigation plans for the future.
Although a denser number of data points all along the investigated time interval would be needed to evaluate rate of changes, some periods seem to have been affected by rapid changes. This is the case for three apparent floodings: 1) at the end of the Sasanian period, 2) in 1303–1307 AD and 3) at the beginning of the 17th century. For example, for the relatively well-documented 17th century, the rise of 6.6 m be- tween 1590 AD and 1638 occurred at an average rate of change of 14 cm per year. This is more than during the recent increase: 10.7 cm per year between 1977 and 1995 (Arpe et al., 2020).
highstand. The next older date at a high level (point 22 at − 21.5 m in Turali) is at 1160 cal BC (median probability), thus clearly older than a supposed “2600 yr BP highstand”. Therefore, the data most commonly used to define this “2600 yr BP highstand” are now in the Parthian highstand and no data exist in Kroonenberg et al. (2007) and Varush- chenko et al. (1987) for this period showing a highstand, when the dates are respectively re-calibrated or calibrated. Therefore, this highstand could not be documented here despite in-depth literature search, although it may perhaps otherwise exist.
5.2.2. What of the Derbent regression?
A problem of terminology exists for this period. The name “Derbent regression” or “Derbent lowstand” is generally attributed to the Medi- eval period but actually seems to refer to two distinct times, both times of lowstands. Some investigations report it at 580–600 AD (Varush- chenko et al., 1987; Klige and Myagkov, 1992; Hoogendoorn, 2006;Kroonenberg et al., 2008) whereas other investigations report it at 1000–1200 AD (Karpychev, 2001; Svitoch, 2012). No stratotype has been defined. The most recent age attribution is the only that justifies calling the Derbent Regression a Medieval regression, as the first one falls in the Sasanian period of Late Antiquity. In some cases, the two lowstands are somewhat blurred together (Rychagov, 1997). It seems however more logical to call the earlier period only the Derbent Regression as this is when the initial wall was built in the Sasanian period, and to avoid using the term Medieval. We recommend thus here to keep away from this appellation or at least call for caution in its usage with clear age precision.
5.2.3. Comparison to the 2013 curve
In comparison to the curve of 2013 (Naderi Beni et al., 2013) starting in the Medieval period, the main difference in the present curve is the much lower water level obtained before 1303–1307 AD. This is mainly due to the rejection of the Brückner date at 915–921 AD based on ob- servations on the Derbent Wall that has probably been reconstructed since, after several earthquakes and coastal subsidence (Brückner, 1890).
5.2. Comparison to other curves
In brief for the period between 1000 and 2200 years ago, our work clearly proposes a pronounced mid-Parthian highstand possibly following a distinct Parthian lowstand, a Late Parthian to mid-Sasanian deep lowstand, a Late Sasanian moderate highstand, and a Medieval period with moderately low levels. Afterwards, the information collated here for the LIA confirms previously published work.
5.2.1. Does the “2600 yr BP highstand” exist?
The Rychagov curve based on uncalibrated dates led him state that
CSL did not go higher than − 25 m in the last 2500 years (Rychagov, 1977). Although radiocarbon dates are provided in an appendix to his 1977 work, no metadata are available on the precise location and elevation of the samples, nor on the type of material dated, thus making them not sufficiently precise for the purpose of this investigation. In the Turali lagoon, four dates (further to those discussed earlier) are pub- lished for the period before 2200 yr BP (Kroonenberg et al., 2007). Their calibration with the new FRO indicates that they are all between 360 and 200 cal BC (median probabilities); moreover none are from sedi- ment at an elevation as high as − 24 m (DAG LG HV04; at cal 153 BC-cal 131 AD). Thus the “2600 yr BP highstand” is not represented in the Turali dataset of Kroonenberg et al. (2007). No dates in the work of Varushchenko et al. (1987) cover the “2600 yr BP highstand” as seen by the calibration of dates at points 25 and 22 in his work. Point 25 is at the mouth of the river Ulluchai in Dagestan at − 22.7 ± 2 m and 2440 ± 120 14C BP. When calibrated, it gives an age of 391 cal BC– cal AD171, with a median probability of 109 cal BC, and thus falls in the Parthian on the Amu Darya (Boroffka, 2010; Sala, 2019). The Amu Darya flows close to the Bukhara and the Amu Darya Faults where the palaeo Amu Darya splits off from its modern channel, The river is also close to the Ural-Turkestan suture near Urgench. Both areas have known historical and modern tectonic movements (Thomas et al., 1998).
The Syr Darya might have bypassed the Aral Sea and flowed directly in the Amu Darya due to human-made diversions, hence increasing the flow to the Caspian Sea in the early 15th century (Boroffka, 2010; Sala, 2019). In consequence, Khwarasmian river diversions by dam building were frequent between 1221 AD and 1575 (Herzfeld, 1947), but water was reaching the Caspian Sea only until 1417 AD according to Boroffka (2010) (Fig. 8 and 9a). In our reconstruction, it is indeed only at the end of the 15th century that the CSL falls below present-day for ca 100 years before re-increasing.
The Westerlies transport most moisture needed for precipitation to the Caspian Sea and over the drainage basin of the currently inflowing rivers. Stronger Westerlies will bring more precipitation, but will also cause an export of the water vapor further to the east and thus cause a net loss of water for the Caspian drainage basin (Arpe et al., 2020). However, the Summer Indian Monsoon may currently also influence CSL, albeit indirectly. Indeed, meteorological analyses (Schiemann et al., 2007) have shown that a stronger monsoon would warm the air passing over the Pamir - Hindu Kush Mountains where the head waters of the Amu Darya are, causing the melting of glaciers, thus increasing the flow in this important river. In the rare cases when there is river diversion to the CS, then the impact may be felt.
Global temperature and summer temperature from tree rings in the Russian Altai both show the Medieval Climatic Anomaly with higher temperatures and the LIA with colder temperatures (Büntgen et al., 2016; PAGES 2k Consortium et al., 2019) (Fig. 9b). In addition, tree ring analysis has highlighted the Late Antique Little Ice Age, LALIA (Büntgen et al., 2016), which was a long-lasting northern hemisphere cooling dated at 536 AD – ~660 (Büntgen et al., 2016) (Fig. 9c), part of the Dark Ages Cold Period at 400–765 AD (Helama et al., 2017) and the warmer temperatures of the Warm Roman period.
In brief, regarding CSL, the balance between precipitation and evaporation is clearly affected by temperature. However as stated before, it will be in the end the loss of water (as vapor) from the CS drainage that will take precedence.
5.3.2. Causes of CSL changes over time
A combination of human and natural causes must be envisaged for an explanation of CSL changes.
The causes of the Late Parthian-Early Sasanian data-poor period (180 AD to 450) could be a very low sea level, leaving on the coast de facto very little traces behind. This low level would have significantly increased the area of the coastal flood plain and free important surfaces newly available to agriculture.
Although the date of the Late Sasanian highstand does not fit the Hun destruction of late 4th century, it is possible that further wars occurred between the Persian Empire, Turkic tribes and Huns in the lower Amu Darya (Oxus) region. Thus further damage to hydraulic infrastructure might have been the reason for the rapid water level increase in the Caspian Sea. This daring hypothesis is triggered by destructions that occurred in the same place but several centuries later. From the climatic point of view the Late Sasanian transgression fits well the LALIA (Fig. 9c). The Late Parthian regression corresponds to the early part of the Warm Roman Period (Fig. 9b and c).
During the Medieval Climate Anomaly, tree-ring analyses in western central Asia indicate that, since 618 AD, the warmest period is between 800 AD and 1000 (Esper et al., 2002), which is also seen in the tree-ring- inferred June–July-August (JJA) temperatures from the Russian Altai (Büntgen et al., 2016) (Fig. 9c). The warmest climatic period seems to have occurred before the expansion of Mongols. The link between climate and CSL is not straightforward as this warm period might have favoured increased evaporation (thus low CSL), although increased precipitations occur during warmer periods as shown in Arpe and Leroy et al. (2007) and Roshan et al. (2012) and lead to an inverse effect on CSL.
The LIA highstand clearly results from multiple causes. The LIA is defined by its colder and wetter climate not only globally, but also in central Asia (references in Putnam et al., 2016) (Fig. 9c). Tree-ring an- alyses on western central Asia indicate that, since 618 AD, the coldest decades are in 1600–1650 AD, within a longer cold period from 1600 AD to 1800 (Esper et al., 2002). Wetter than current climate in the LIA seems to have favoured Mongol steppe pastoralists and people move- ments by a southward displacement of grassland (Putnam et al., 2016). The deserts of Kwarazm would have needed to be greener in order to sustain large numbers of horses required by the Mongol army (Putnam et al., 2016). Destruction of irrigation dams by the Mongol invasion at 1221 AD and the Timurid wars at 1372–1388 AD (Sala, 2019) are related to this climatically-driven population movements.
Arpe et al. (2000) highlighted the importance of El-Nin ̃o Southern Oscillation (ENSO) for CSL changes. Molavi-Arabshahi et al. (2016) showed a southward shift of the Jet Stream over the Caspian Sea during El Nin ̃o events and, with it, a shift of the strong baroclinicity that guides cyclone tracks, bringing more precipitation to the Caspian catchment; thus higher El-Nin ̃o events would lead to more precipitation over the Caspian Basin.
In brief it is impossible to assign the various highstands and low- stands to a linear temperature forcing (Fig. 9). Indeed, in one case a cold climate corresponded to a low CSL and in another one to high CSL: clearly the LALIA and the LIA correspond for the former to a lowstand and for the latter one to a highstand. The explanation might perhaps lie with the precipitation that is largely governed by ENSO. It is not yet fully established what the state of ENSO was over the last 2000 years. How- ever, Yan et al. (2011) suggest that it was higher both in the Dark Ages Cold Period and the LIA. Rein et al. (2004) consider as a major anomaly a much weaker el-Nin ̃o activity during the Medieval period than during the periods before and after.
The Medieval Climate Anomaly that is warm in central Asia corre- sponds to relatively low levels (Fig. 9). The Roman Warm Period con- tains several short-term fluctuations as seen in the tree rings; but the number of CSL points is too low to attach them to any of those short-term climatic fluctuations.
The two extremes in our CSL curve, i.e. the very low levels at 580 AD and the very high levels at 1303–1304 AD (Fig. 9), are both most likely not due to climate only. While the first one has an unknown cause, the second one is most likely owing to a purposeful malignant Amu Darya diversion.
6. Conclusions
In the Caspian Sea, the difficulties of choosing an appropriate radiocarbon calibration scheme and the progress made recently have led to cacophonic and discordant approaches by various authors: no cali- bration, successive and diverse marine calibrations and successive terrestrial calibrations. This situation has hampered a harmonious combination of information from geology, archaeology, and history. An improved understanding of freshwater reservoir offsets and recalibra- tion of radiocarbon dates with the most recent calibration curve has enabled us to harmonize the timescales of previous datasets where sufficient metadata were available.
Our investigation has highlighted two significant issues when naming well-known lowstands and highstands over of the last >2200 years. Firstly, caution is called when using the term Derbent lowstand, because of the confusing literature. It is thus advised to precisely and clearly state the age and to separate the mid-Sasanian lowstand from the truly Medieval lowstand. Secondly, the evidence used in literature to define the “2600 yr BP highstand” has been revised by calibration or recalibration of the original 14C dates. This revision does not show a highstand at 2600 yr BP (because no data are available at that time, when calibrating the dates) but at a more recent time at ca 50 BC–50 AD termed here the mid-Parthian highstand. Thus again caution should be used, and the name “2600 yr BP highstand” should not be used unless strong, most likely new, data justify it.
A conservative estimation of CSL amplitude change reaches 15 m over the last 2200 years (perhaps even more, i.e. 20 m) with at times high rates of changes calculated as 14 cm per year. Therefore the amplitude is at minimum five times larger than that of the last century, and the rate of change is 25% higher. If such changes were to happen now, our society would have difficulties facing it; it would thus lead to a disaster of likely catastrophic scale. Although we are technologically more advanced, none of the mentioned causes of CSL changes can be avoided nowadays; as indeed a mix of natural hazards, climatic and human causes are invoked to explain the observed CSL changes.
Most interestingly, over the last 2200 years no simple correlation between climate (temperature, precipitation) and sea levels could be found. Although some important changes may be attributed to human interventions (e.g. river diversions), at the larger time scale, climate has to be the main forcing factor. However global temperatures do not seem to be the sole forcing factor, perhaps due to the confounding impact of ENSO and human activities on river diversion.
The current research indicates that further investigations to improve the precision of the Caspian Sea level curve over the last millennia re- quires well documented radiocarbon ages with a small confidence in- terval, on well-chosen samples, to be obtained from sites with accurate elevation measurements. Under these conditions only, further insight into water level drivers will come within reach.
